PyTorch 1.8.1で入ったPyTorch Profilerを使ってみた
3月終わりごろ、PyTorch の1.8.1がリリースされました。1.8.0から1.8.1でsmall bugfixだけかと思ってたら、元々あったautograd profilerの次のバージョンのprofilerという形でPyTorch Profilerが追加されたことがPyTorchのblogで紹介されました。今回はこのPyTorch Profilerがどんなことができるのか?を確かめてみたので、それについて紹介していきます。
目次
PyTorch Profilerとは?
元々PyTorchにはautograd profiler (torch.autograd.profiler)というprofilerがありました。これを改良してものがPyTorch Profiler (torch.profiler)としてPyTorch 1.8.1で追加されました。blogの記事を読んだり、実際に触ってみた感じだと以下のところが変わっています。
- GPU Kernelも取れるようになった
scheduleという仕組みを使ってある程度イテレーションが進んでからprofileを開始して、またしばらく止めて、というものを繰り返し行えるようになった- TenserBoardと連携して、いろいろな角度から簡単にprofile結果を見れるようになった。
個人的には2、3が有用かなと思っています。profileを取る際、Deep Learningの学習によっては数epoch進んだところで突然遅くなるというようなことがあります。2の仕組みを使えば毎epochちょっとだけprofileを取ってどこが遅くなっているのかチェックしやすくなったという印象です。また、3のTensorBoardでprofile結果をみるというものが使ってみたら思った以上にお手軽にいろいろ確認できました。GPUのprofileはNsight Systemsを使ったほうが操作性や情報量という意味ではいいのですが、ぱっと試すなら十分かなという印象です。
PyTorch Profilerを実際に使ってみた
ここからは実際の使い方をコードと共に3つ紹介していきます。このblogではコードの一部だけを抜粋してお見せしますが、動くjupyter notebookのコードをここに置いておきます
https://github.com/shu65/blog-pytorch-notebooks/blob/main/pytorch_mnist_profiler.ipynb
動作環境は2021/04/02時点のGoogle Colabで確認しています。
autograd profilerと同じように使ってみる
まずは前からあるautograd profilerと同じようにtorch.profiler.profileを指定します。
with torch.profiler.profile(
    activities=[
        torch.profiler.ProfilerActivity.CPU,
        torch.profiler.ProfilerActivity.CUDA],
    ) as p:
...
指定されたwith ブロックの範囲が実際にprofileが取られるコードの領域です。activities で取得したい計算リソースを指定します。この例だとactivitiesが指定してありますが、defaultだとGPUが利用できる場合はGPUとCPU、GPUが利用できない場合はCPUのみになるようです。
このコードのあと、以下のようにp からprofile結果を取得します。
print(p.key_averages().table(
    sort_by="self_cuda_time_total", row_limit=-1))
結果の取得部分はautograd profilerのときと同様です。
試しに以下のようにしてprofileを取得してみます。
max_steps = 50
steps = 0
with torch.profiler.profile(
    activities=[
        torch.profiler.ProfilerActivity.CPU,
        torch.profiler.ProfilerActivity.CUDA],
    ) as p:
  for epoch in range(1, epochs + 1):
    model.train()
    for batch_idx, (data, target) in enumerate(train_loader):
        data, target = data.to(device), target.to(device)
        optimizer.zero_grad()
        output = model(data)
        loss = F.nll_loss(output, target)
        loss.backward()
        optimizer.step()
        if batch_idx % log_interval == 0:
            print('Train Epoch: {} [{}/{} ({:.0f}%)]\tLoss: {:.6f}'.format(
                epoch, batch_idx * len(data), len(train_loader.dataset),
                100. * batch_idx / len(train_loader), loss.item()))
        steps += 1
        if steps >= max_steps:
          break

print(p.key_averages().table(
    sort_by="self_cuda_time_total", row_limit=-1))
この場合このような出力が得られました。
-------------------------------------------------------  ------------  ------------  ------------  ------------  ------------  ------------  ------------  ------------  ------------  ------------
                                                   Name    Self CPU %      Self CPU   CPU total %     CPU total  CPU time avg     Self CUDA   Self CUDA %    CUDA total  CUDA time avg    # of Calls
-------------------------------------------------------  ------------  ------------  ------------  ------------  ------------  ------------  ------------  ------------  ------------  ------------
                                aten::cudnn_convolution         0.49%      19.464ms         0.72%      28.671ms     238.925us     123.177ms        29.58%     123.177ms       1.026ms           120
                aten::cudnn_convolution_backward_weight         0.20%       8.055ms         0.32%      12.645ms     126.450us      79.688ms        19.14%      79.688ms     796.880us           100
void cudnn::cnn::wgrad_alg0_engine<float, 512, 6, 5,...         0.00%       0.000us         0.00%       0.000us       0.000us      73.604ms        17.68%      73.604ms       1.472ms            50
                                             aten::add_         0.43%      17.013ms         0.72%      28.723ms      31.221us      36.778ms         8.83%      36.778ms      39.976us           920
                 aten::cudnn_convolution_backward_input         0.14%       5.761ms         0.23%       9.207ms     184.140us      34.936ms         8.39%      34.936ms     698.720us            50
void at::native::vectorized_elementwise_kernel<4, at...         0.00%       0.000us         0.00%       0.000us       0.000us      34.314ms         8.24%      34.314ms     103.982us           330
                                  volta_sgemm_128x64_nn         0.00%       0.000us         0.00%       0.000us       0.000us      31.713ms         7.62%      31.713ms     528.550us            60
scheduleを使ってみる
次は個人的に注目しているscheduleを使ったprofileです。scheduleでは以下の4つの引数で、profileを取るタイミングとprofleを取る回数を制御します。
wait: profileが止まっているイテレーション数warmup: profileを準備するイテレーション数active: profileを取得し続けるイテレーション数repeat: wait、 warmup 、 active の合計数を1サイクルとして、これを何サイクル繰り返すか?の指定
そして、scheduleをprofileを取るときに引数で渡します。また、profileが終わったタイミングで実行する関数もprofileの引数に渡します。今回はサンプルにあるのと同じように、self_cuda_time_total という項目でソートして出力するようにします。コードとしては以下の通りです。
def trace_handler(prof):
    print(prof.key_averages().table(
        sort_by="self_cuda_time_total", row_limit=-1))

with torch.profiler.profile(
    activities=[
        torch.profiler.ProfilerActivity.CPU,
        torch.profiler.ProfilerActivity.CUDA],
    schedule=torch.profiler.schedule(
        wait=5,
        warmup=5,
        active=10),
    on_trace_ready=trace_handler
    ) as p:
  for batch_idx, (data, target) in enumerate(train_loader):
    ...
    p.step()
この例ではwaitが5イテレーション、warmupが5イテレーションの合計10イテレーション後、10イテレーションprofileを取るというものを1サイクルしています。repeatを指定してないので、with ブロックを抜けるまでprofileのサイクルを繰り返します。
そしてwith ブロックの中でp.step() 呼ぶようにすればを完成です。特にp.step() を忘れがちになると思われるので注意してください。
実際のコードを以下に示します。
def trace_handler(prof):
    print(prof.key_averages().table(
        sort_by="self_cuda_time_total", row_limit=-1))

max_steps = 50
steps = 0
with torch.profiler.profile(
    activities=[
        torch.profiler.ProfilerActivity.CPU,
        torch.profiler.ProfilerActivity.CUDA],
    schedule=torch.profiler.schedule(
        wait=5,
        warmup=5,
        active=10),
    on_trace_ready=trace_handler
    ) as p:
  for epoch in range(1, epochs + 1):
    model.train()
    for batch_idx, (data, target) in enumerate(train_loader):
        data, target = data.to(device), target.to(device)
        optimizer.zero_grad()
        output = model(data)
        loss = F.nll_loss(output, target)
        loss.backward()
        optimizer.step()
        p.step()
        if batch_idx % log_interval == 0:
            print('Train Epoch: {} [{}/{} ({:.0f}%)]\tLoss: {:.6f}'.format(
                epoch, batch_idx * len(data), len(train_loader.dataset),
                100. * batch_idx / len(train_loader), loss.item()))
        steps += 1
        if steps >= max_steps:
          break
このときの出力は以下の通りです。
Train Epoch: 1 [0/60000 (0%)]	Loss: 0.152974
-------------------------------------------------------  ------------  ------------  ------------  ------------  ------------  ------------  ------------  ------------  ------------  ------------
                                                   Name    Self CPU %      Self CPU   CPU total %     CPU total  CPU time avg     Self CUDA   Self CUDA %    CUDA total  CUDA time avg    # of Calls
-------------------------------------------------------  ------------  ------------  ------------  ------------  ------------  ------------  ------------  ------------  ------------  ------------
                aten::cudnn_convolution_backward_weight         0.91%       1.501ms         1.51%       2.484ms     124.200us      15.845ms        29.65%      15.845ms     792.250us            20
void cudnn::cnn::wgrad_alg0_engine<float, 512, 6, 5,...         0.00%       0.000us         0.00%       0.000us       0.000us      14.627ms        27.37%      14.627ms       1.463ms            10
                                aten::cudnn_convolution         2.53%       4.169ms         3.33%       5.485ms     274.250us       8.038ms        15.04%       8.038ms     401.900us            20
                 aten::cudnn_convolution_backward_input         0.83%       1.372ms         1.25%       2.069ms     206.900us       6.972ms        13.05%       6.972ms     697.200us            10
void fft2d_c2r_32x32<float, false, false, 0u, false,...         0.00%       0.000us         0.00%       0.000us       0.000us       3.373ms         6.31%       3.373ms     168.650us            20
                 aten::max_pool2d_with_indices_backward         0.17%     287.000us         0.63%       1.042ms     104.200us       3.324ms         6.22%       3.730ms     373.000us            10
void at::native::(anonymous namespace)::max_pool_bac...         0.00%       0.000us         0.00%       0.000us       0.000us       3.324ms         6.22%       3.324ms     332.400us            10
void fft2d_r2c_32x32<float, false, 0u, false>(float2...         0.00%       0.000us         0.00%       0.000us       0.000us       3.242ms         6.07%       3.242ms     162.100us            20
...

                                         aten::addcmul_         1.23%       2.023ms         3.58%       5.901ms      36.881us       0.000us         0.00%       1.518ms       9.488us           160
                                            aten::sqrt_         1.12%       1.851ms         3.31%       5.450ms      34.062us       0.000us         0.00%       1.097ms       6.856us           160
-------------------------------------------------------  ------------  ------------  ------------  ------------  ------------  ------------  ------------  ------------  ------------  ------------
Self CPU time total: 164.893ms
Self CUDA time total: 53.445ms

-------------------------------------------------------  ------------  ------------  ------------  ------------  ------------  ------------  ------------  ------------  ------------  ------------
                                                   Name    Self CPU %      Self CPU   CPU total %     CPU total  CPU time avg     Self CUDA   Self CUDA %    CUDA total  CUDA time avg    # of Calls
-------------------------------------------------------  ------------  ------------  ------------  ------------  ------------  ------------  ------------  ------------  ------------  ------------
                aten::cudnn_convolution_backward_weight         0.77%       1.370ms         1.28%       2.279ms     113.950us      16.035ms        30.03%      16.035ms     801.750us            20
void cudnn::cnn::wgrad_alg0_engine<float, 512, 6, 5,...         0.00%       0.000us         0.00%       0.000us       0.000us      14.817ms        27.75%      14.817ms       1.482ms            10
                                aten::cudnn_convolution         2.54%       4.519ms         3.32%       5.901ms     295.050us       8.005ms        14.99%       8.005ms     400.250us            20
                 aten::cudnn_convolution_backward_input         0.75%       1.336ms         1.15%       2.052ms     205.200us       6.992ms        13.09%       6.992ms     699.200us            10
void fft2d_c2r_32x32<float, false, false, 0u, false,...         0.00%       0.000us         0.00%       0.000us       0.000us       3.368ms         6.31%       3.368ms     168.400us            20
                 aten::max_pool2d_with_indices_backward         0.14%     257.000us         0.61%       1.085ms     108.500us       3.325ms         6.23%       3.725ms     372.500us            10
void at::native::(anonymous namespace)::max_pool_bac...         0.00%       0.000us         0.00%       0.000us       0.000us       3.325ms         6.23%       3.325ms     332.500us            10
...
このように複数回profileが取られていることがわかります。
TensorBoardと連携してみる
最後にTensorBoardとの連携のやり方を紹介します。
TensorBoardと連携する場合は以下のように追加packageを入れます。
pip install torch-tb-profiler今回はtorch-tb-profiler-0.1.0を利用します。
インストール後、以下のようにon_trace_ready のところに torch.profiler.tensorboard_trace_handler() を指定します。torch.profiler.tensorboard_trace_handler() の引数に指定しているのはTensorBoard用のlogファイルの出力ディレクトリです。
with torch.profiler.profile(
    activities=[
        torch.profiler.ProfilerActivity.CPU,
        torch.profiler.ProfilerActivity.CUDA],

    schedule=torch.profiler.schedule(
        wait=0,
        warmup=1,
        active=2),
    on_trace_ready=torch.profiler.tensorboard_trace_handler('./tb_log'),
    ) as p:
...
あとはJupyter Notebookで以下のようにTensorBoardを起動します。
%tensorboard --logdir tb_logTensorBoardでは次に説明するようにOverview, Operator, GPU Kernel, Traceというviewが用意され、profile結果をいろいろな角度から解析することができます。
Overviewの場合
Profileの結果の概要のviewです。viewでは全イテレーションの合計とイテレーション別にカテゴリ毎にどれくらい時間がかかったか?を表示してくれます。
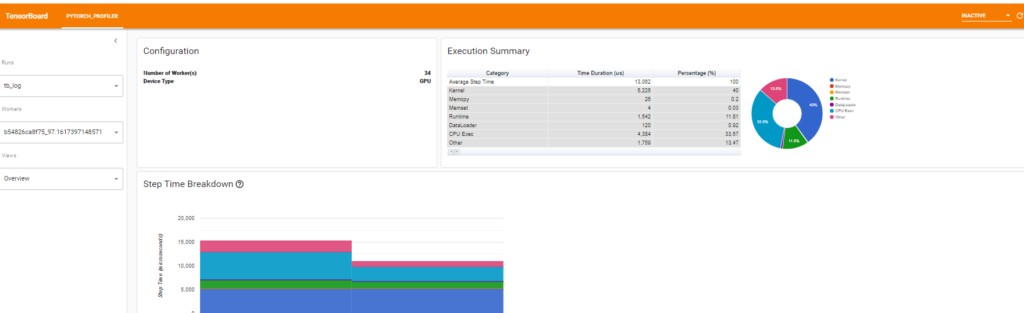
カテゴリの種類としては以下の通りです。
- Kernel: GPU Kernelの時間
- Memcpy: CUDAのmemcpyの時間
- Memset: CUDAのmemsetの時間
- Runtime: CUDAのRuntimeの時間(cudaLaunchKernel, cudaMemcpyAsync, cudaStreamSynchronizeなど)
- DataLoader: DataLoaderの時間
- CPU Exec: PyTorch OperatorなどのCPU上での実行時間
- Other: その他
また、「Performance Recommendation」のところではどこが遅いかとどのようにすれば解決できそうかが表示されます。
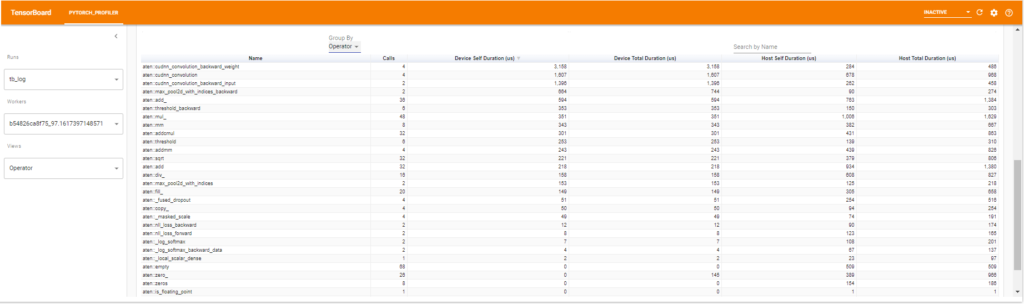
Operatorの場合
PyTorchのOperatorについてのviewです。以下のようにDevice(GPUのこと)とHost(CPUのこと)ごとに計算時間の全体、指定した上位のOperator数に占める割合をみれます。
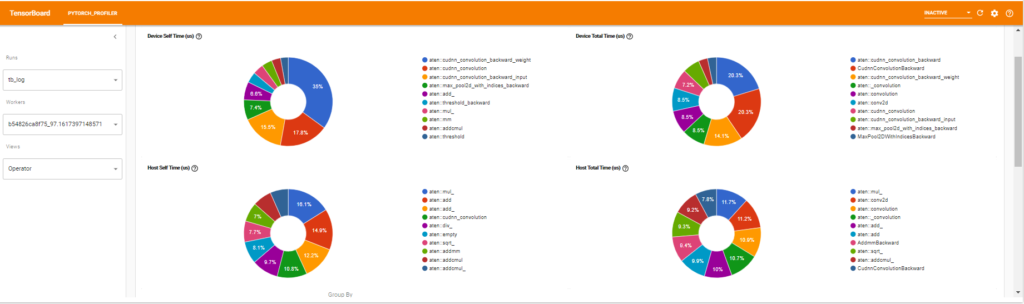
これに加えて以下のようにテーブルでより詳細に確認することもできます。profileする際にinput shapeの情報を取っていればGroup Byでinput shape別にまとめた結果も見れます。
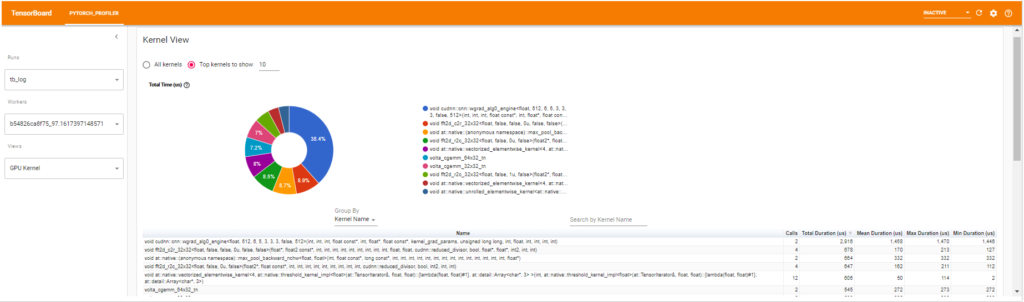
GPU Kernelの場合
GPU Kernelについてのviewです。GPUのKernelの全体、または上位の指定したKernel数に占める割合と各Kernelの詳細をテーブルが表示されます。
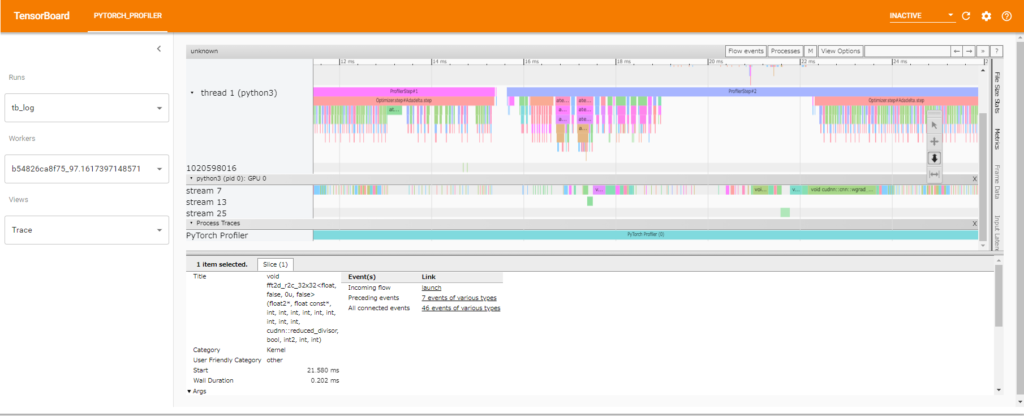
Traceの場合
Traceのviewです。chromeのtraceで表示されるものと同じものです。
終わりに
PyTorch Profilerの使い方を紹介しました。以前、「PyTorchでGPUの計算時間を正しく計測する」という記事でGPUの計算時間の測定方法を紹介しましたが、いろいろな関数をまとめて取る場合はPyTorch Profilerの利用が一番手軽に取れる方法かと思います。この記事が皆さんの研究開発の手助けになれば幸いです。